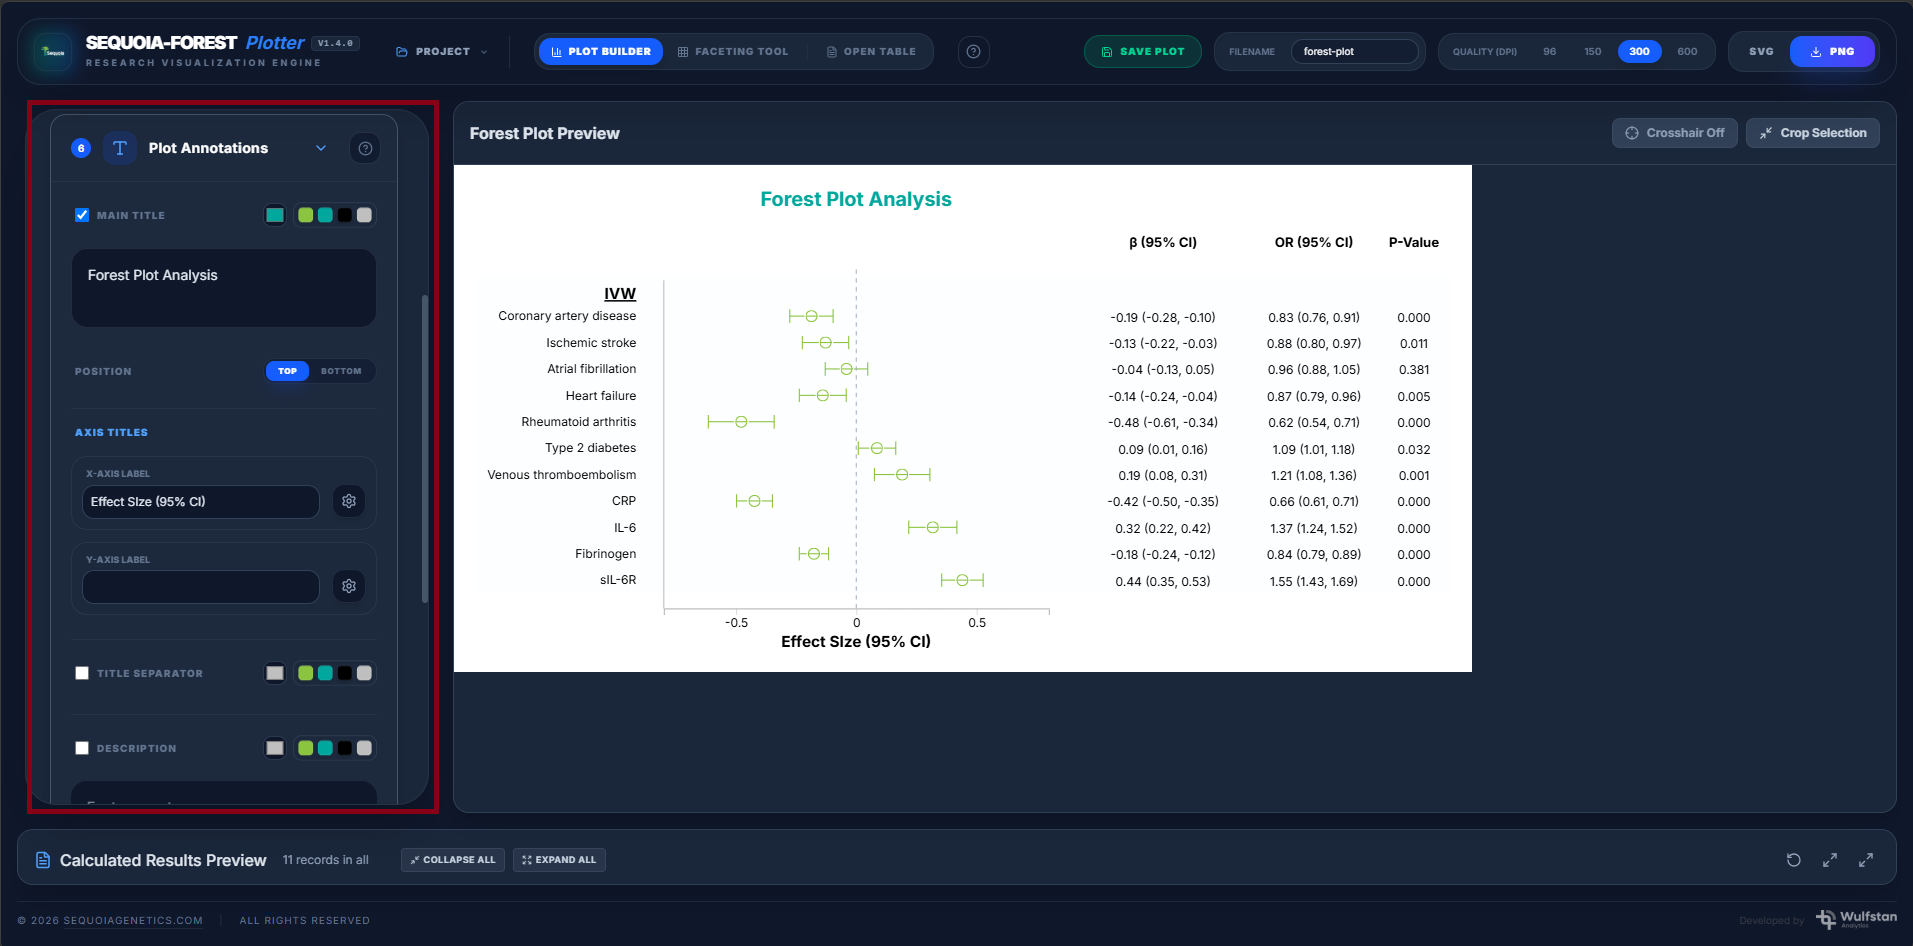
The Plot Annotations section allows you to add a title, axis labels and supporting description to the forest plot.
Main Title
Use the main title to explain what the plot shows.
Example:
Forest Plot Analysis
Better examples:
- Association Results for IL18-Related Outcomes
- Forest Plot of Treatment Effects by Study
- Odds Ratio Summary Across Clinical Outcomes
Title Position
The title can be positioned at the top or bottom of the plot.
Recommended setting: Top
Title Separator
Use the title separator if you want a visual separation between the title and the plot area.
This is useful for presentation or report-ready plots.
Axis Titles
Use axis titles to make the plot easier to understand.
Examples:
| Axis | Description | Example Title |
| X-axis | Label displayed below the x-axis | Effect Size with 95% CI, Odds Ratio with 95% CI |
| Y-axis | Label displayed beside the row labels | Trait, Study Outcome |
Description
Use the description field to add more context.
Examples:
- Dataset source.
- Analysis date.
- Filter criteria.
- Study population.
- Confidence interval method.
- Notes about interpretation.
Alignment
You can align annotation text based on your preferred layout.
Common options:
- Left
- Center
- Right
Text Size
Adjust the text size to improve readability.
Recommended starting value: 13 px