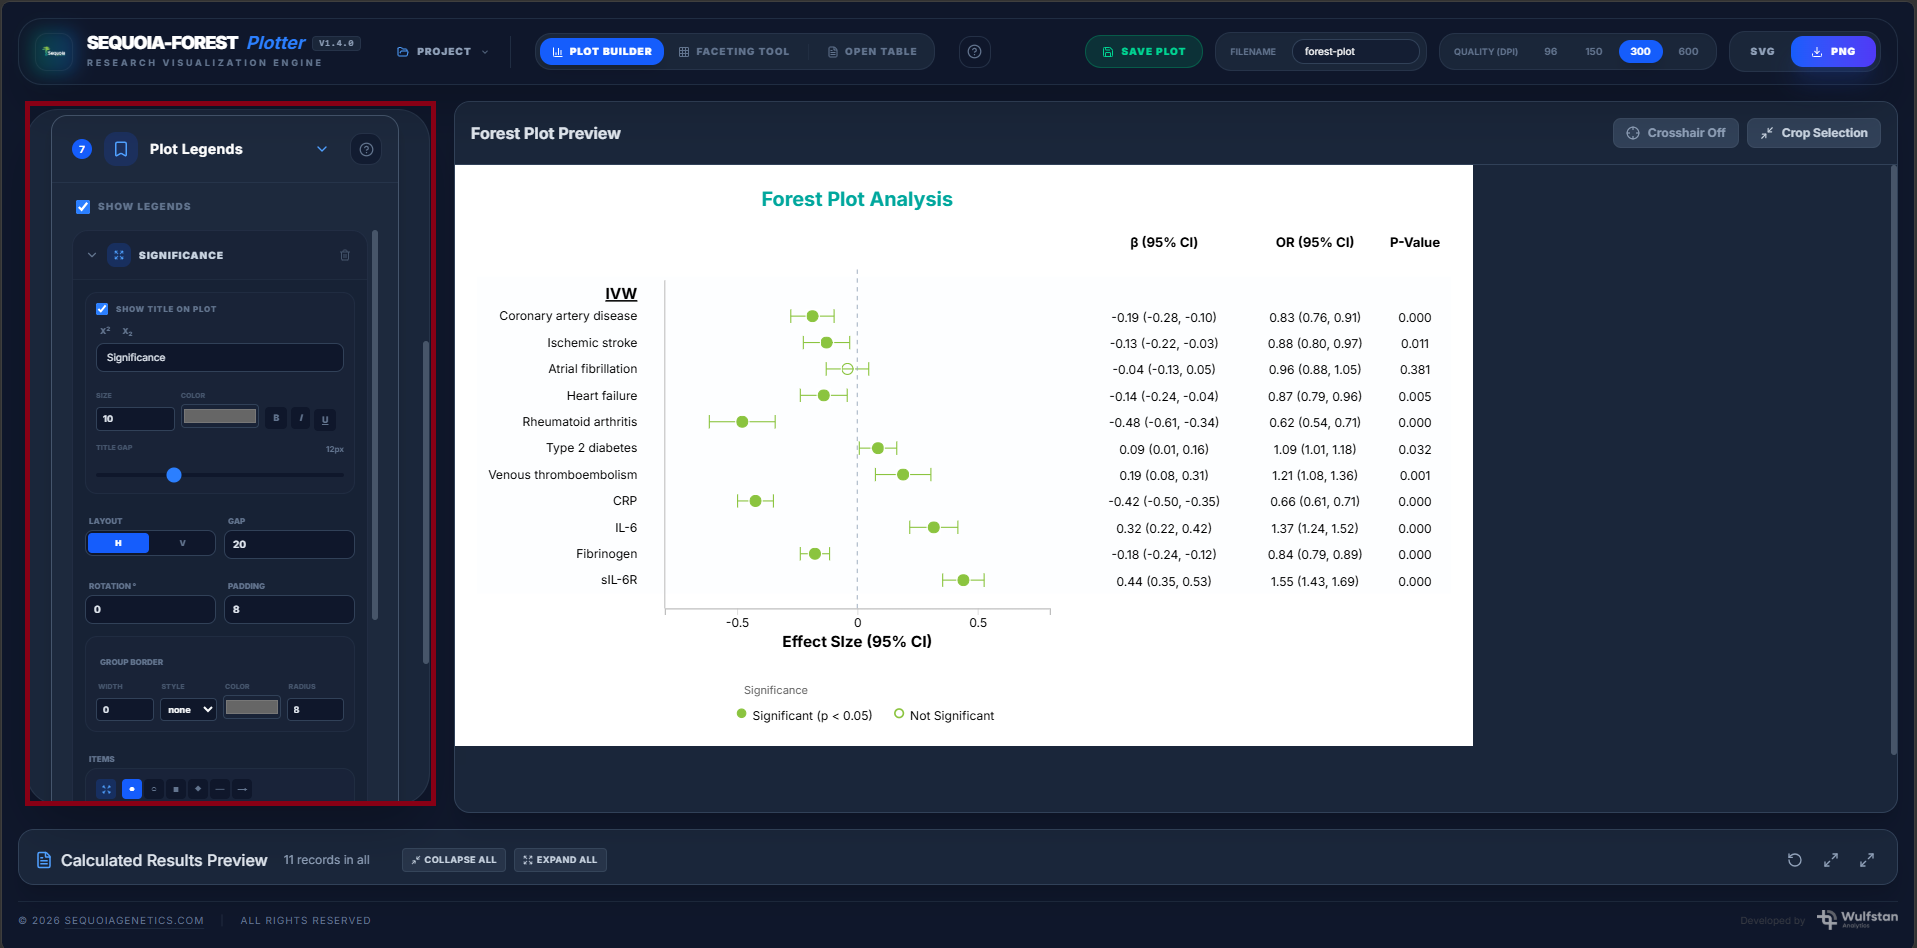
The Plot Legends section controls the legend shown on the plot.
The legend communicates significance thresholds and category encodings. The tool does not automatically restyle markers by p-value; all significance annotation is configured here as manually defined legend items.
Show Legends
Enable Show Legends to display legend information on the plot.
Disable it if the legend is not needed or if the plot is too crowded.
Significance Legend
A common legend is used to show statistical significance.
Example:
| Legend Item | Meaning |
| Significant | p < 0.05 |
| Not Significant | p ≥ 0.05 |
Enable this option if you want the legend title to appear inside the plot.
Legend Layout
The legend can be displayed in different layouts:
| Layout | Recommended Use |
| Horizontal | Small number of legend items |
| Vertical | Multiple legend items or grouped legends |
Legend items can use different symbols, including:
- Filled circle
- Empty circle
- Square
- Diamond
- Line
- Arrow
Group Border
You can style the legend border using:
- Border width
- Border style
- Border color
- Border radius
Available border styles include:
- None
- Solid
- Dashed
- Dotted
Add Item
Use Add Item to add another legend value.
Example:
- Protective effect
- Risk effect
- Significant
- Not significant
- Primary analysis
- Secondary analysis
Add Legend Group
Use Add Legend Group when you need separate legend sections.
Example groups:
- Significance
- Direction of effect
- Study category
- Population group