
The Canvas & Display section controls the spacing, zoom, and layout of the forest plot.
Use these settings when the plot looks too compressed, too large, or when labels overlap.
Canvas Padding
Canvas padding controls the space around the full plot.
Increase padding when:
- Labels are close to the edge.
- Legends are too close to the border.
- The plot needs more breathing room.
Global Zoom
Global zoom controls the overall size of the plot.
Increase zoom when:
- Text is too small.
- Plot elements are difficult to read.
Decrease zoom when:
- The plot is too large.
- You need to fit more content on screen.
Row Height
Row height controls the vertical spacing between rows.
Increase row height when:
- Row labels overlap.
- The plot contains long labels.
- The plot needs better readability.
Decrease row height when:
- The dataset has many rows.
- You want a more compact view.
Column Gap
Column gap controls the spacing between visible columns.
Increase this value if visible columns appear too close together.
Plot Label Gap
Plot label gap controls the spacing between row labels and the plot area.
Plot Gap
Plot gap controls spacing between plot sections.
Header Vertical Gap
Header vertical gap controls the spacing around group headers.
Use this when group headings appear too close to plot rows.
Reset Defaults
Use Reset Defaults to return canvas and display settings to their original values, without affecting mappings, grouping, or theme settings.
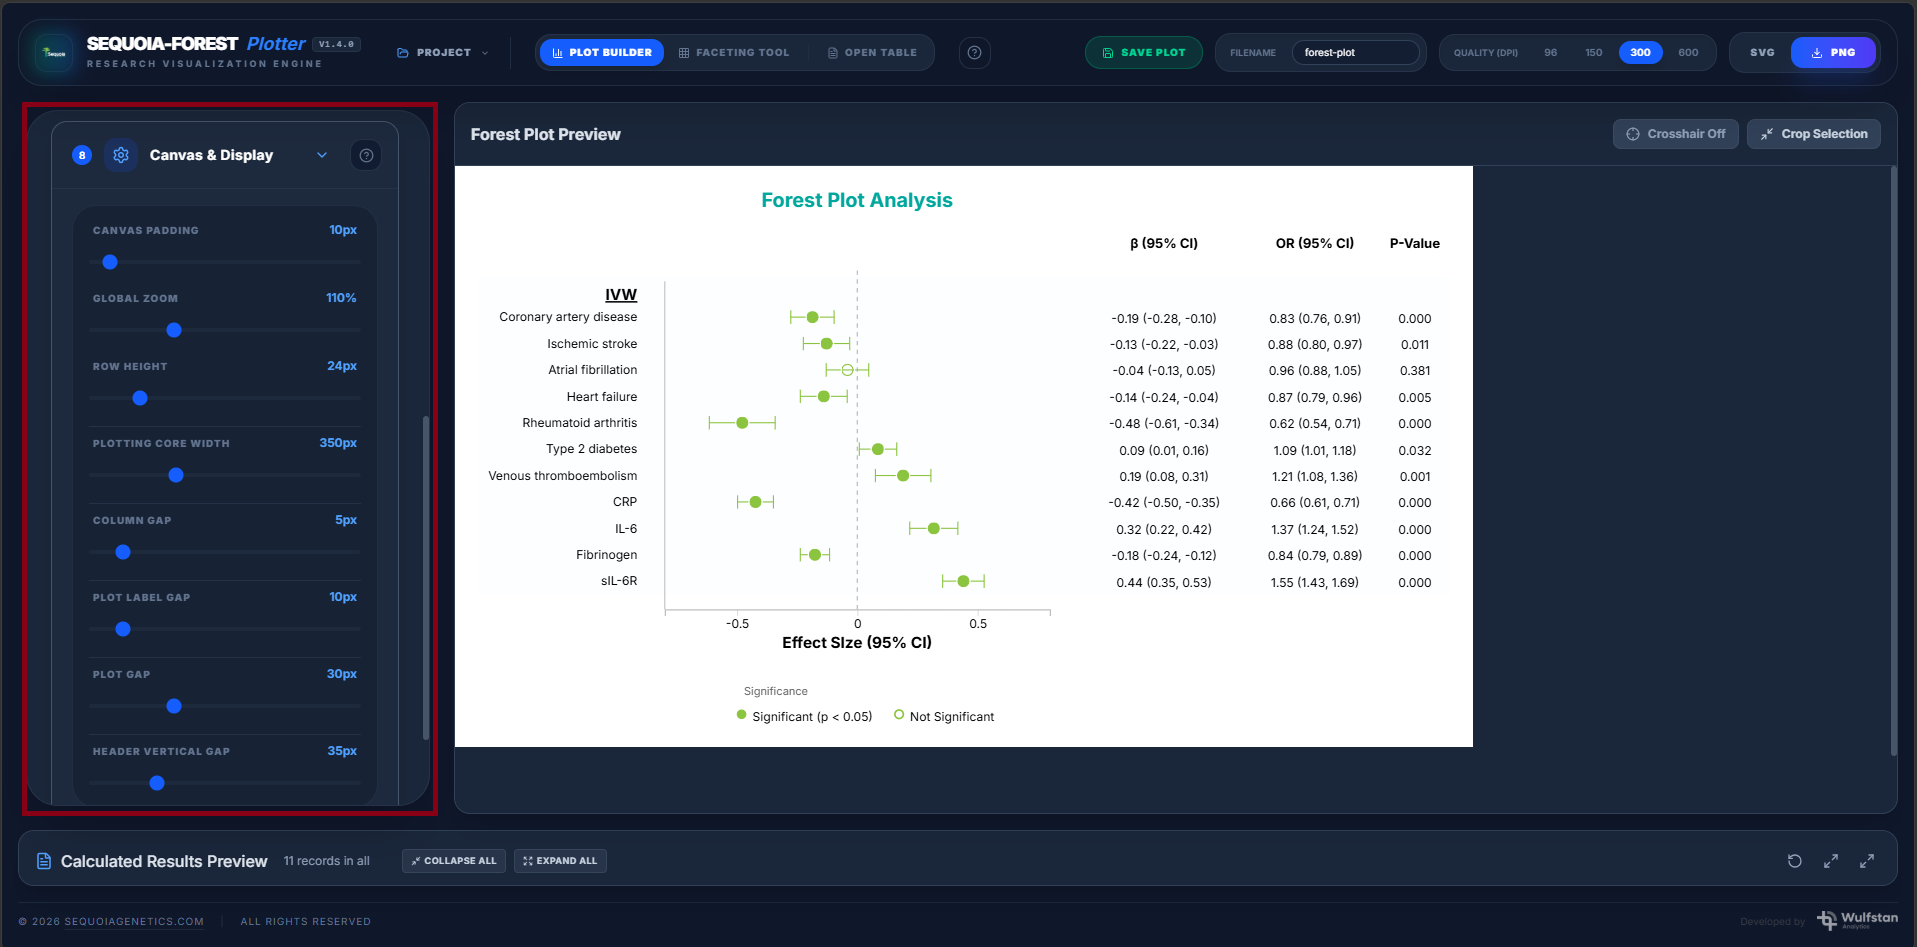
SCREENSHOT: Canvas & Display panel with adjusted plot area