
The Map Data Columns section tells the tool which CSV columns should be used to create the forest plot.
Column names in the CSV are irrelevant; any column can be assigned to any field via the dropdown. The tables below show how standard upstream pipeline outputs map to each field.
Plot fields
| Field | Required | Function |
|---|---|---|
| Effect Size | Yes | Main effect estimate, such as Beta or Log-OR. Plotted on x-axis as point estimate |
| Standard Error | Optional | Used to compute 95% CI as β ± 1.96 × SE when Lower CI and Upper CI are not mapped |
| P-Value | Recommended | Used for significance legend annotation (article 06) |
| Lower CI | Recommended | Direct CI lower bound. Takes precedence over SE-derived CI when both Lower CI and Upper CI are mapped |
| Upper CI | Recommended | Direct CI upper bound. Must be mapped together with Lower CI |
CI source precedence
When both Lower CI + Upper CI columns and an SE column are mapped, the direct CI columns are used, and SE is ignored for CI display. SE remains available for other purposes (e.g., as a visible column).
Y-axis column
Selected in the Map Data Columns section. The Y-axis column controls the row labels in the plot.
Common Y-axis label columns include:
- Study name
- Trait
- Gene
- Phenotype
- Outcome
- Comparison
- Variant
The grouping column (article 04) is selected separately.
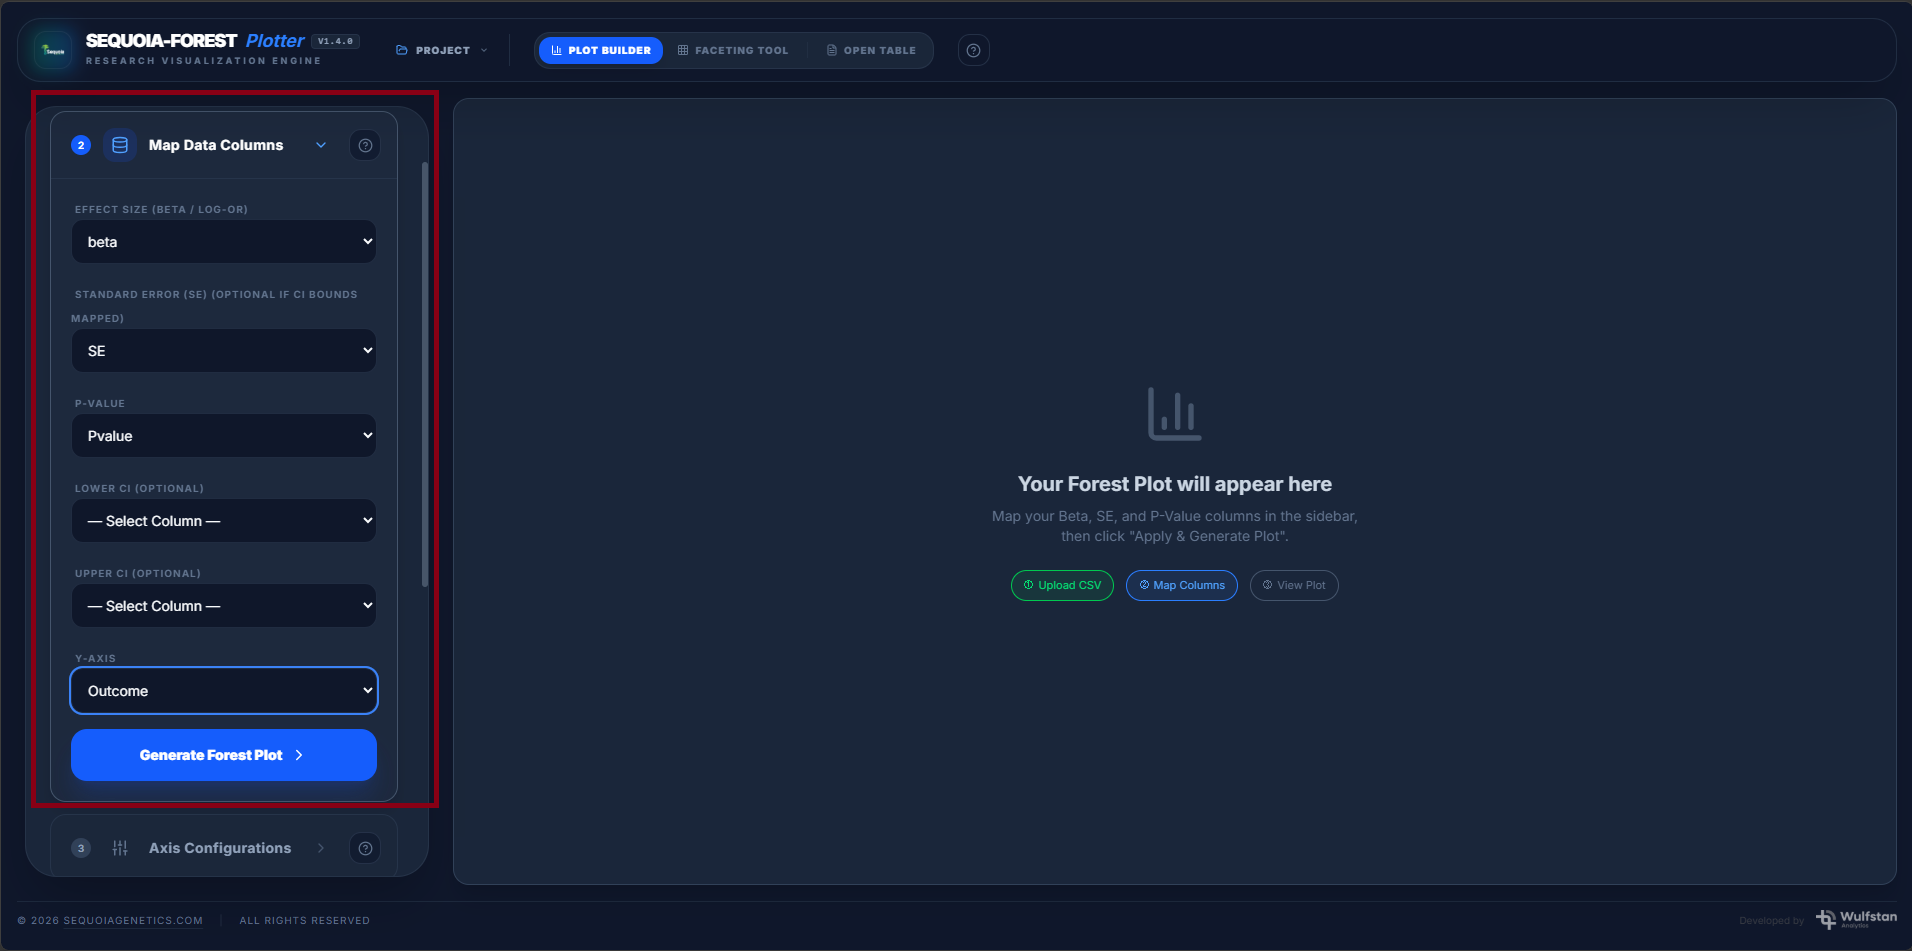
Generate Forest Plot
After mapping the required fields, click Generate Forest Plot.
If the plot does not appear, check that:
- A CSV file has been uploaded.
- The effect size column is mapped.
- The Y-axis label column is selected.
- CI or SE data is available.
- Numeric columns contain valid values.