
Use Open Table to view the uploaded CSV data inside the tool.
This helps you confirm that the uploaded data is correct before generating the final plot.
Why Use Table View?
Table View helps you check:
- Whether the CSV uploaded correctly.
- Whether column names are detected.
- Whether numeric values are valid.
- Whether grouping fields contain expected values.
- Whether the correct rows are included.
Recommended Checks
Before generating the plot, check:
- Are all expected columns visible?
- Are numeric columns formatted correctly?
- Are any values missing?
- Are the Y-axis label values readable?
- Are group/category values correct?
- Are p-values and confidence intervals correct?
When to Use Table View
Use Table View:
- Immediately after uploading a CSV file.
- Before mapping columns.
- When the plot looks incorrect.
- When sorting or grouping does not behave as expected.
- Before saving or publishing the final plot.
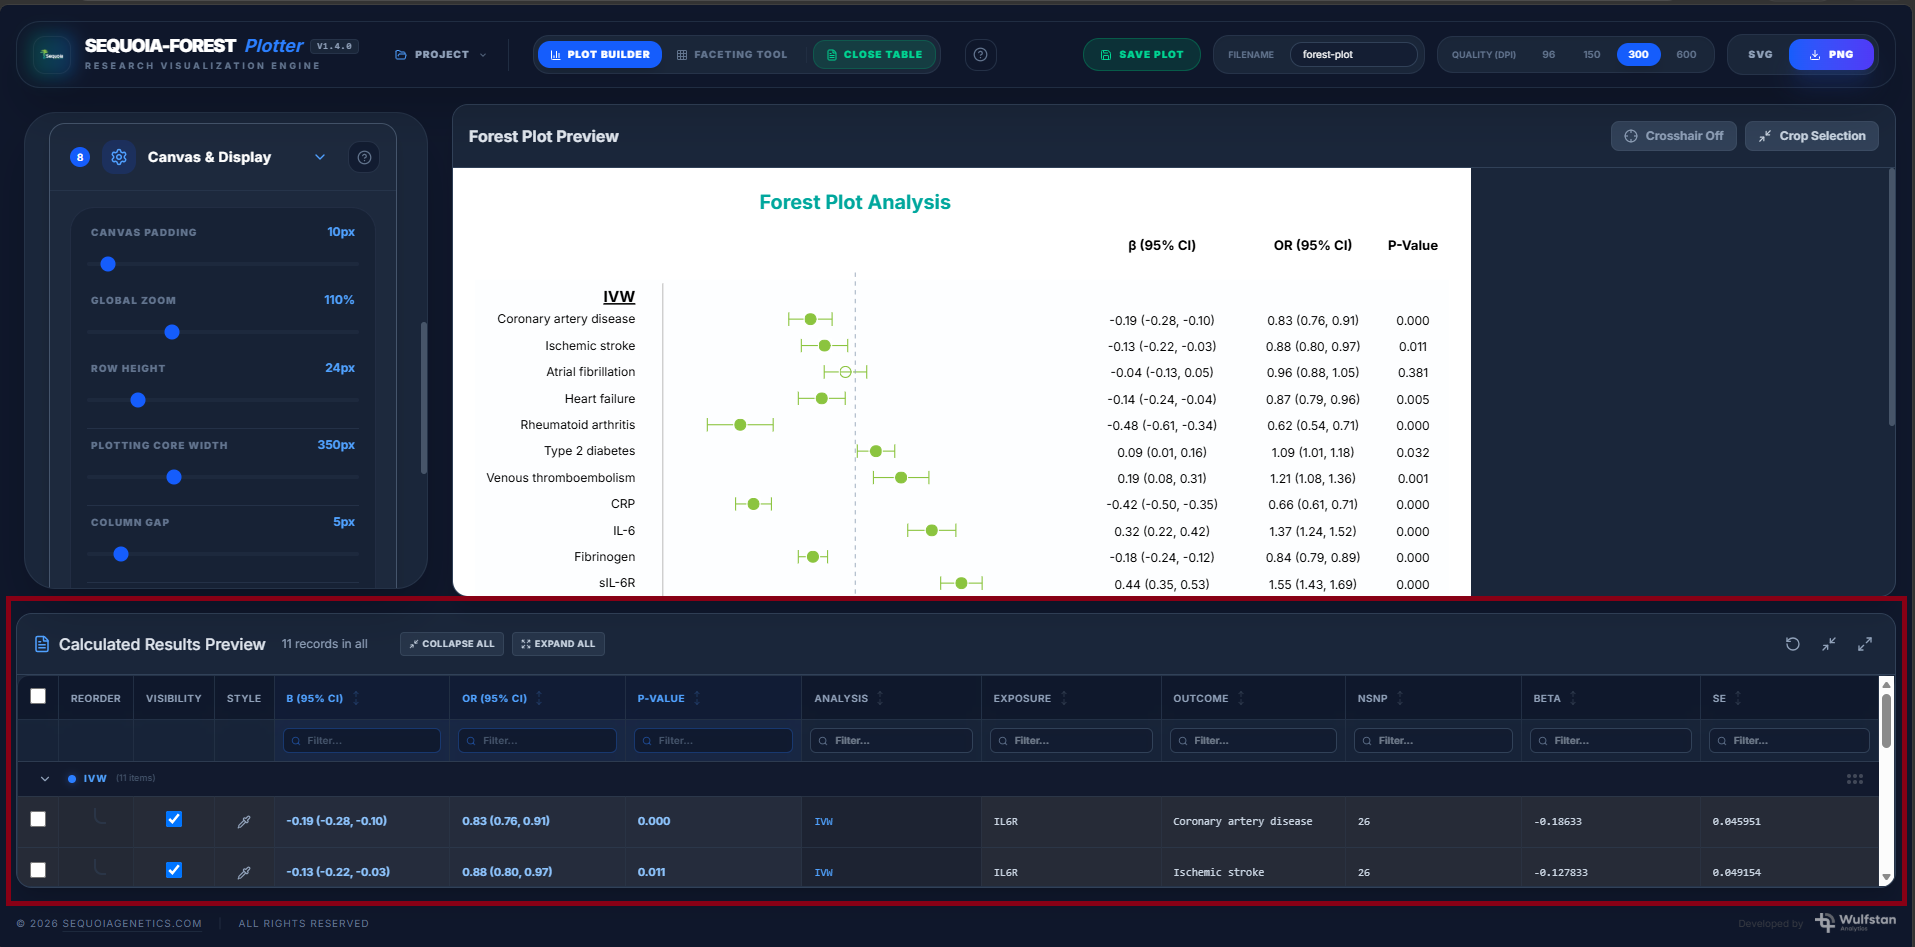
SCREENSHOT: Table View open, showing the demo dataset loaded correctly.