
Grouping and Sorting
The Grouping & Selection section helps organize plot rows. Grouping partitions rows into labeled sections within a single plot.
This is useful when your dataset contains many rows or multiple categories.
Grouping Column
Use the grouping column to divide rows into sections. Any CSV column. Rows sharing the same value in the grouping column are placed in the same section.
Examples of grouping columns:
- Disease area
- Study group
- Population
- Cohort
- Gene
- Drug class
- Outcome type
If grouping is not needed, select No Grouping.
Show Headers
Enable Show Headers to display group names in the plot. When enabled, the group name is displayed as a header row above each section. This makes the forest plot easier to read when multiple groups are included.
Disable when group membership is evident from row labels or when plot density makes headers unnecessary.
Sort in Groups
Enable Sort in groups when you want sorting to happen inside each group. When enabled, each sort level is applied independently within each group rather than globally across all rows.
For example, if rows are grouped by disease area, sorting can be applied within each disease area instead of across the full dataset.
Multi-Level Sorting
Use multi-level sorting to sort by more than one field.
Example:
- Sort by group.
- Sort by p-value.
- Sort by effect size.
The tool supports up to five sorting levels.
Each level specifies a column and direction (ascending / descending). Levels are applied in priority order; later levels resolve ties from earlier levels. Sort operates on all CSV columns, not only mapped fields.
When to Use Grouping
Use grouping when:
- The dataset has many rows.
- Rows belong to clear categories.
- You want to compare results by group.
- You need a cleaner plot structure.
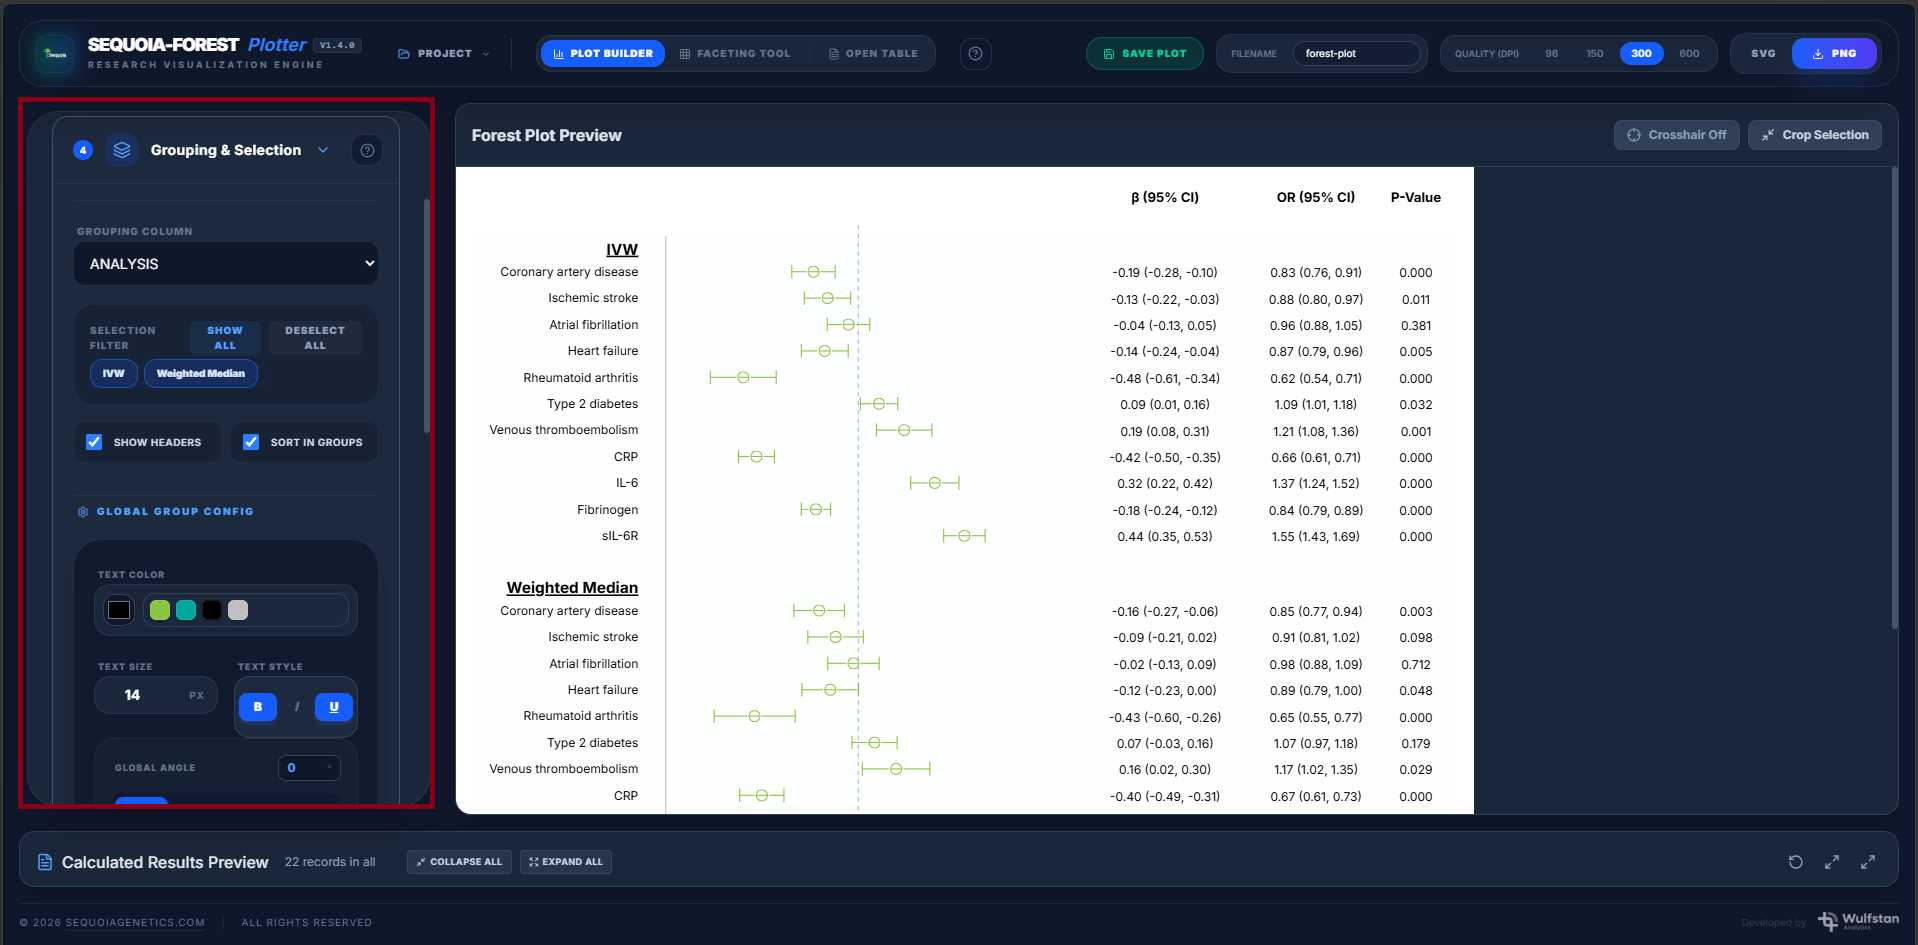
SCREENSHOT: Forest plot generated after grouping by analysis method (IVW or Weighted median)