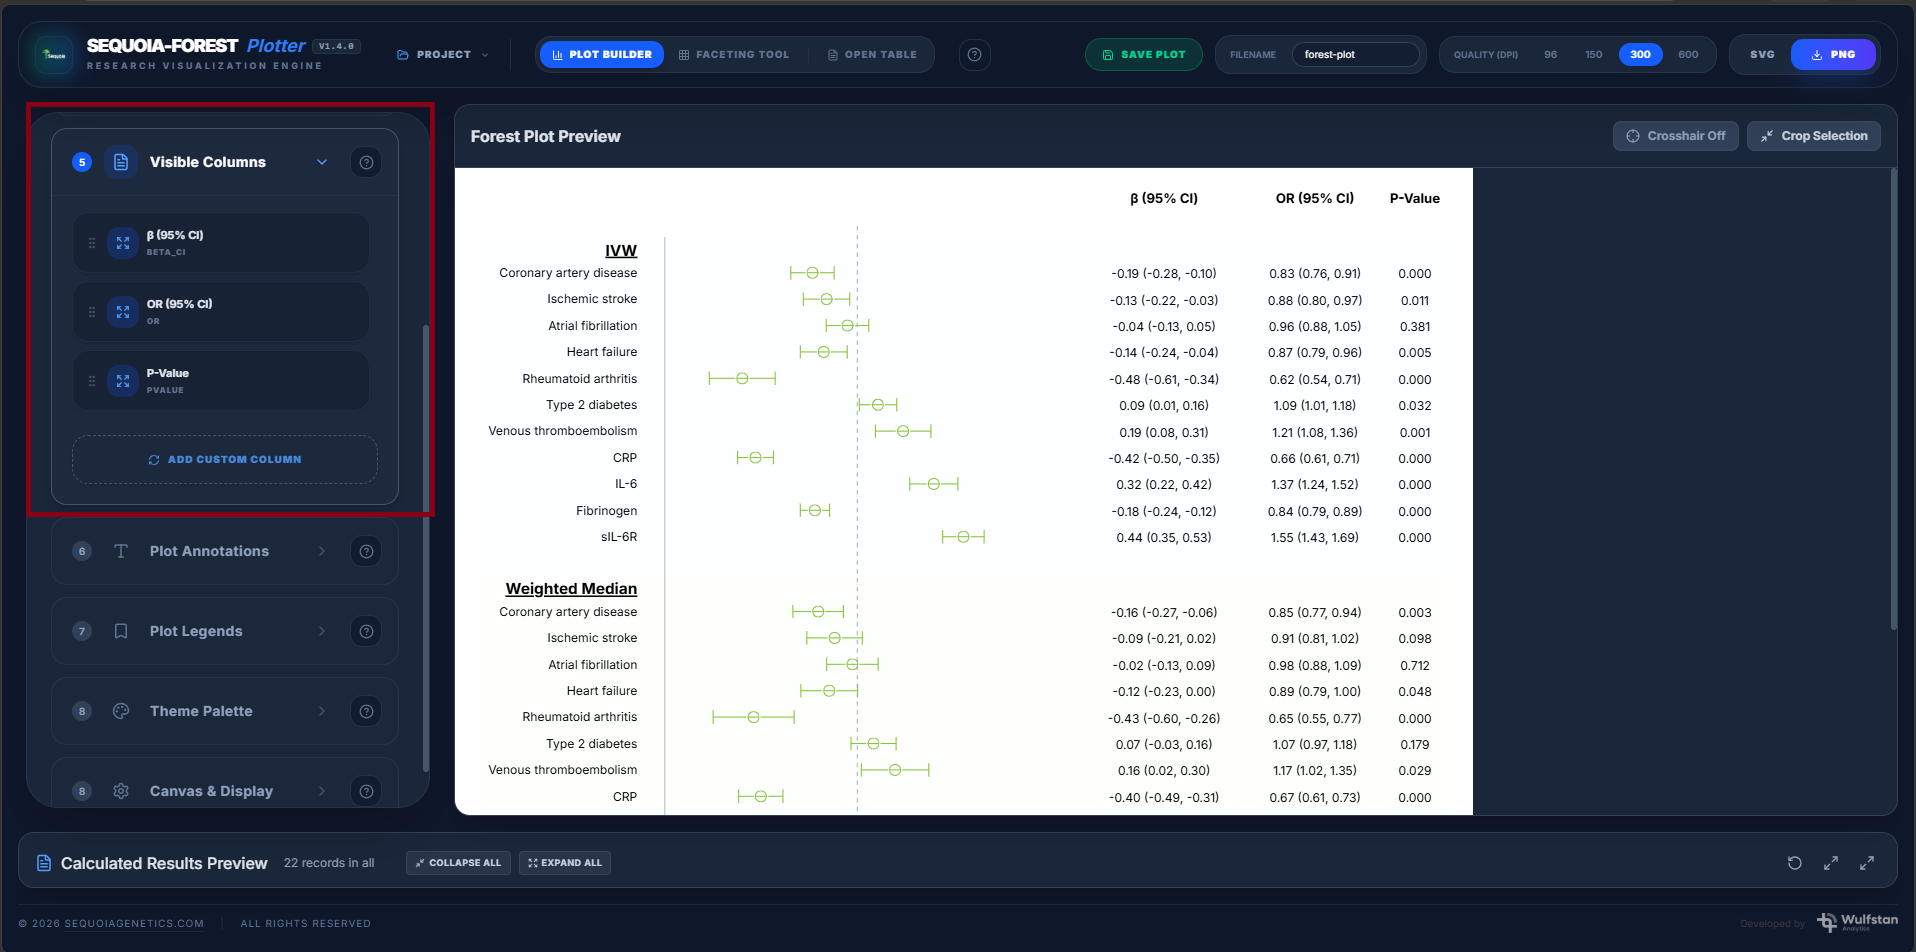
Visible Columns
The Visible Columns section controls which data columns appear beside the forest plot. Adds tabular data columns displayed to the right of the plot, aligned by row. Any CSV column can be added as a visible column.
These columns help users interpret each row without opening the original CSV file.
Behavior
- Cell values are displayed as-is from the CSV; no formatting or rounding is applied by the tool.
- Column headers default to the CSV column name; headers can be edited in the Visible Columns panel.
- Multiple visible columns can be added. Column order in the display matches the order they are added.
- Visible columns are included in exported image files and in saved project files.
Default Visible Columns
The tool may include default visible columns such as:
| Column | Description |
| Beta | Shows the beta or effect estimate |
| P-Value | Shows the p-value |
| β (95% CI) | Shows beta with confidence interval |
| OR (95% CI) | Shows odds ratio with confidence interval |
Add Custom Column
Use Add Custom Column to display additional values from your CSV file.
Examples:
- Sample size
- Cohort
- Study name
- Population
- Disease area
- Drug name
- Notes
- Analysis method